High-Fiber Foods, Ranked
Last updated: September 6, 2026
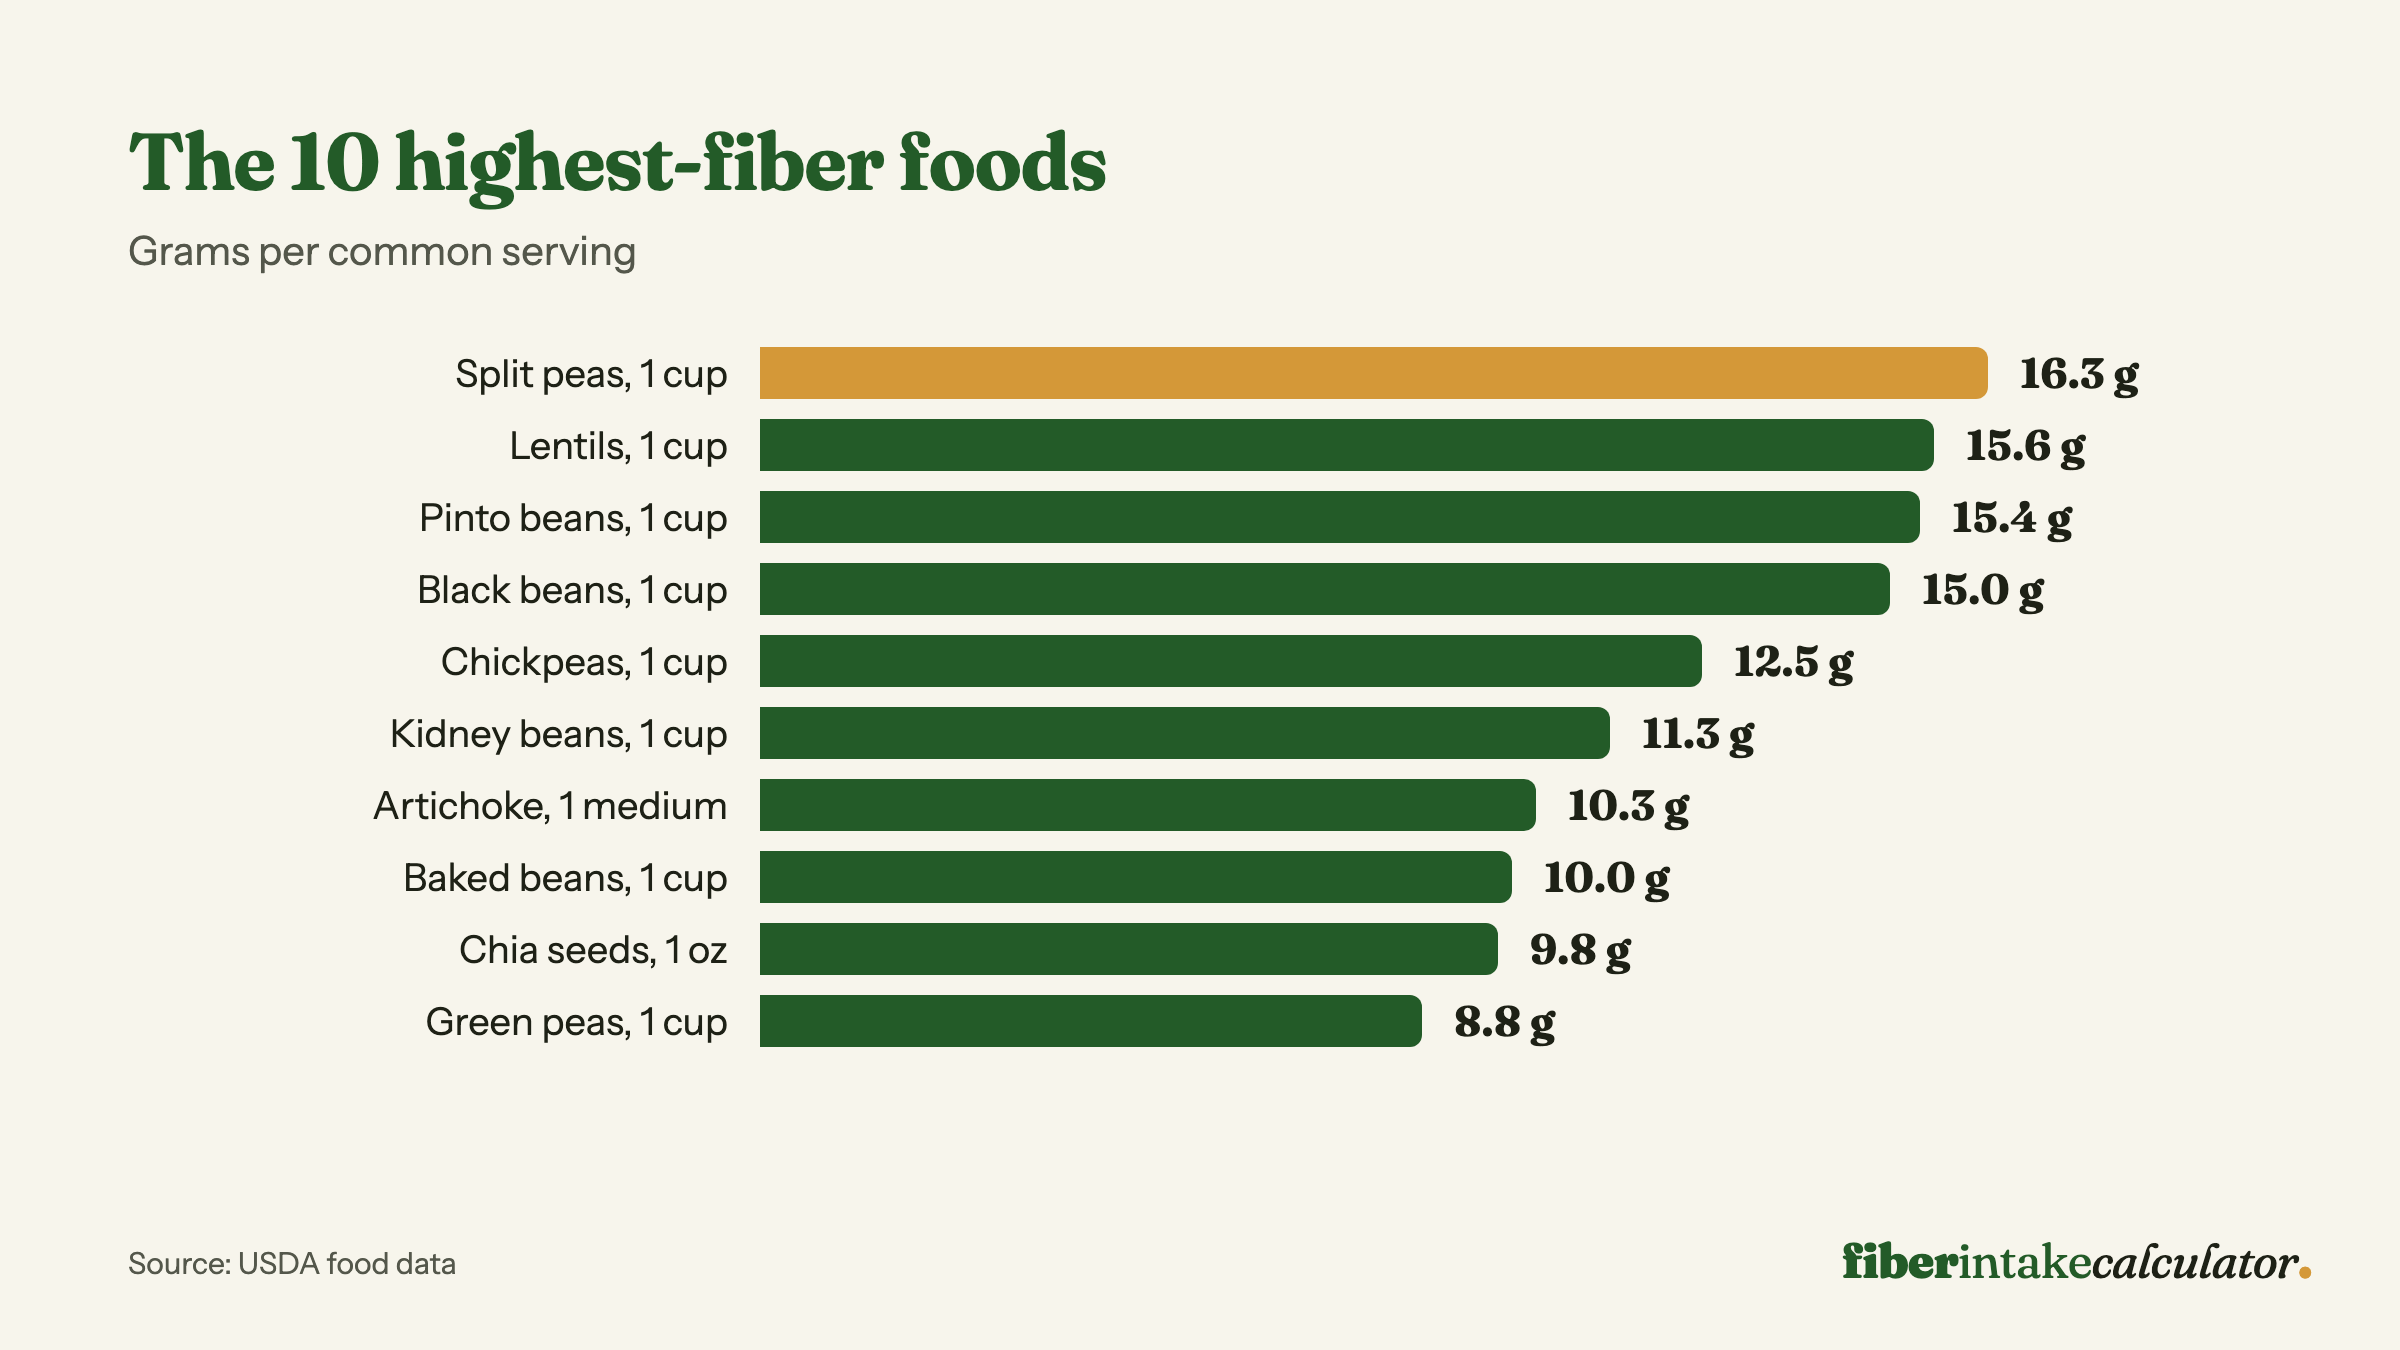
Sort the chart by any column. The % of your target column is personal: it uses the result you saved in the fiber calculator, or the FDA Daily Value of 28 g until you have one.
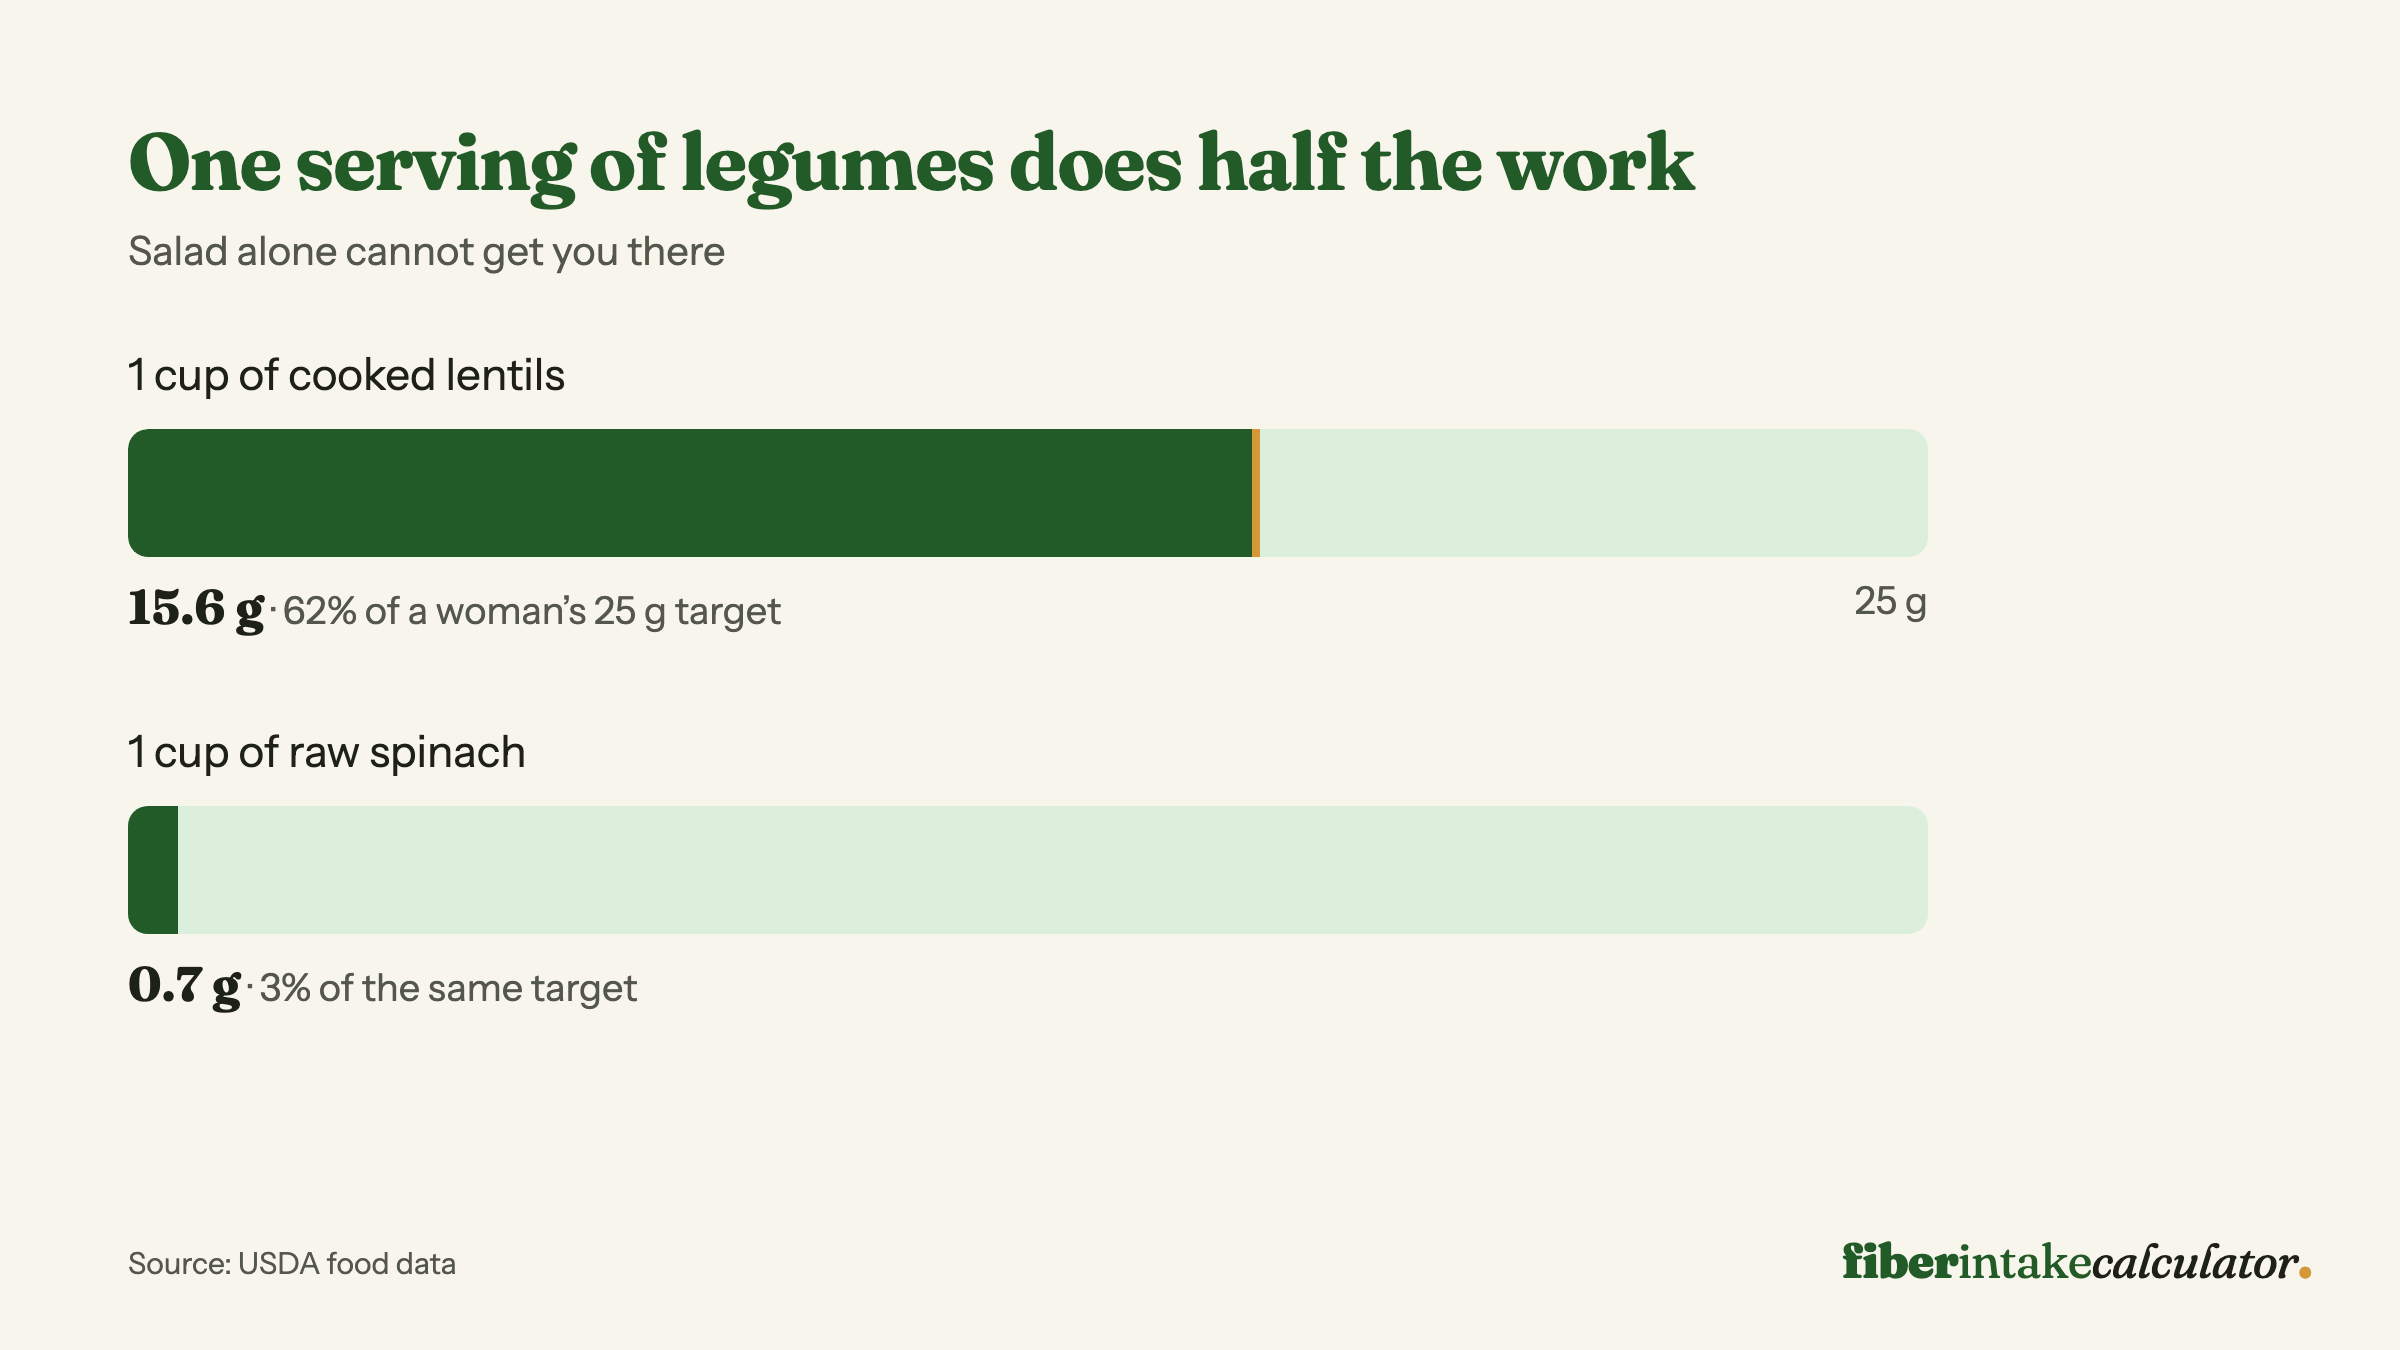
Six foods here reach double digits per serving, and all of them are legumes or seeds. That’s the practical shortcut this chart makes obvious: one daily serving of legumes does a third of the work, and no amount of salad substitutes for it.
It is also why food beats a jar. A cup of cooked lentils carries more fiber than any single dose in our comparison of the best fiber supplements, where a labeled serving ranges from 0.5 to 9 grams.
Fruit is the group people ask about most, so it has its own page. The high-fiber fruits chart ranks 28 fruits by serving and by fiber per calorie, and puts numbers on what peeling and juicing cost you.
| Food | Fiber per serving (g) | Serving | Group | % of your target |
|---|---|---|---|---|
| Split peas, cooked | 16.3 | 1 cup | Legumes | – |
| Lentils, cooked | 15.6 | 1 cup | Legumes | – |
| Pinto beans, cooked | 15.4 | 1 cup | Legumes | – |
| Black beans, cooked | 15 | 1 cup | Legumes | – |
| Chickpeas, cooked | 12.5 | 1 cup | Legumes | – |
| Kidney beans, cooked | 11.3 | 1 cup | Legumes | – |
| Artichoke, cooked | 10.3 | 1 medium | Vegetables | – |
| Baked beans, canned | 10 | 1 cup | Legumes | – |
| Chia seeds | 9.8 | 1 oz (2 tbsp) | Nuts & seeds | – |
| Green peas, cooked | 8.8 | 1 cup | Vegetables | – |
| Bulgur, cooked | 8.2 | 1 cup | Grains | – |
| Edamame, cooked | 8.1 | 1 cup | Legumes | – |
| Raspberries | 8 | 1 cup | Fruit | – |
| Blackberries | 7.6 | 1 cup | Fruit | – |
| Avocado | 6.7 | half (100 g) | Fruit | – |
| Whole-wheat spaghetti, cooked | 6.3 | 1 cup | Grains | – |
| Pearled barley, cooked | 6 | 1 cup | Grains | – |
| Pear, with skin | 5.5 | 1 medium | Fruit | – |
| Bran flakes cereal | 5.5 | 3/4 cup | Grains | – |
| Quinoa, cooked | 5.2 | 1 cup | Grains | – |
| Broccoli, cooked | 5.1 | 1 cup | Vegetables | – |
| Apple, with skin | 4.4 | 1 medium | Fruit | – |
| Brussels sprouts, cooked | 4.1 | 1 cup | Vegetables | – |
| Oatmeal, cooked | 4 | 1 cup | Grains | – |
| Sweet potato, baked with skin | 3.8 | 1 medium | Vegetables | – |
| Potato, baked with skin | 3.8 | 1 medium | Vegetables | – |
| Blueberries | 3.6 | 1 cup | Fruit | – |
| Sweet corn, cooked | 3.6 | 1 cup | Vegetables | – |
| Almonds | 3.5 | 1 oz (23 nuts) | Nuts & seeds | – |
| Popcorn, air-popped | 3.5 | 3 cups | Grains | – |
| Brown rice, cooked | 3.5 | 1 cup | Grains | – |
| Banana | 3.1 | 1 medium | Fruit | – |
| Orange | 3.1 | 1 medium | Fruit | – |
| Strawberries | 3 | 1 cup halves | Fruit | – |
| Pistachios | 3 | 1 oz (49 nuts) | Nuts & seeds | – |
| Flaxseed, ground | 2.8 | 1 tbsp | Nuts & seeds | – |
| Pecans | 2.7 | 1 oz (19 halves) | Nuts & seeds | – |
| Peach, with skin | 2.3 | 1 medium | Fruit | – |
| Kiwi | 2.1 | 1 fruit | Fruit | – |
| Cauliflower, cooked | 2 | 1 cup | Vegetables | – |
| Whole-wheat bread | 1.9 | 1 slice | Grains | – |
| Carrot, raw | 1.7 | 1 medium | Vegetables | – |
Serving values are USDA data as published in standard clinical fiber tables. See the methodology page for how figures are sourced and refreshed.
Frequently asked questions
What food is highest in fiber?
Per standard serving, cooked legumes lead: split peas (16.3 g per cup), lentils (15.6 g), and black beans (15 g). Per bite, chia seeds are the densest common food at 9.8 g per ounce. No single food needs to do the work, though. Most people hit their target by combining legumes, whole grains, fruit, and vegetables across the day.
How do I use this chart to hit my daily target?
First get your personal number from the calculator (most adults need 21 to 38 g). Then pick foods until the '% of your target' column adds to 100. For example, a cup of lentils plus a cup of raspberries plus an apple covers most of a 25 g target.
Are these values per 100 grams or per serving?
Per common household serving (1 cup cooked, 1 medium fruit, 1 oz nuts), the way you actually eat. Serving-based numbers are more practical than per-100 g lab values, which overstate light foods like leafy greens.
Built and maintained by the FiberIntake team, with data from USDA FoodData Central and peer-reviewed sources. Figures are checked against the cited source before publish. About this site →